
Lab Summary
Before lab, students read
background material on water transport in
plants. As they start the lab, teams discuss and
construct a concept map using terms related to water
transport. These maps are then critiqued by
another student group for feedback, modified, and used
to build an understanding of the relationships and
processes used to transport water in vascular plants.
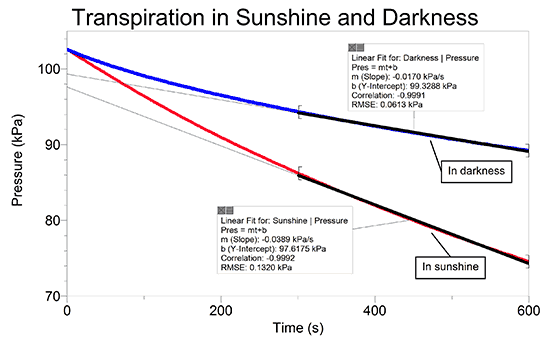
The follow-up lab investigation uses stem/leaf
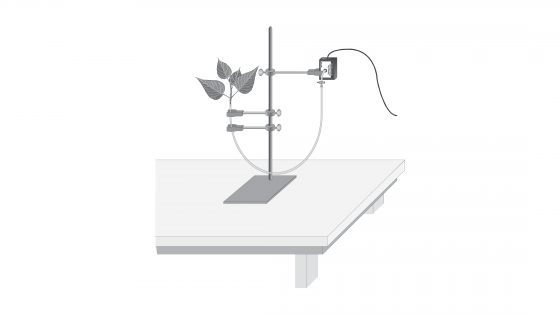
cuttings of plants and Vernier gas pressure sensors to
measure transpiration rates. Students set up and
run a standard control run to become familiar with the
operation of the equipment. Teams then pose a
hypothesis about how an environmental factor might
affect transpiration rate.. The factors could
include light, temperature, wind, humidity, etc.
Each team conducts several experimental trials and
determines the appropriate statistical tests to
compare experimental and control groups. To do
this they will discuss what other factors could be
affecting transpiration rate (particularly leaf area),
and come up with a method (guided by the instructor)
to standardize the results to account for this.
Each student then writes a brief discussion (as
homework) with an emphasis on explaining how these
results apply to plants in nature, to encourage
practice at generalizing results to other situations.
Conceptual Learning Goals
- Upon completion of this lab, students should
be able to
- explain how vascular plants use the physical/chemical properties of water and transport tissues to move water from roots to leaves.
- discuss connections between physical and chemical properties of molecules and structures and physiological functions in plants, and be able apply this knowledge to generate informed hypotheses, experimental methods and predictions.
- use pressure sensors, LoggerPro software, and interpret data from these sensors as it applies to measuring transpiration rates in plants.
Scientific Skills - In this lab students
practice and feedback on
- hypothesis development and testing.
- quantification and statistical analysis of data.
- determining the appropriate statistical test for a particular data set
- using the results of these statistical tests to evaluate and interpret the results of an experiment.
Teaching Theory &
Pedagogy
The traditional approach to
introductory biology labs has been to "cover"
essential concepts and processes in class and then to
immerse students in a highly guided hand-on lab
experience which asks students to use these concepts
to explain data. Labs are often designed to
confirm that a biological process is indeed occurring
as we would predict. These "confirmatory"
labs require that students have been exposed to these
abstract concepts and detailed processes prior to lab
which are then often learned devoid any meaningful
context to the learner. However, in
science it is observations that drive further
exploration, not the reverse. Moreover, in
courses taught using more traditional lab experiences,
there is pressure to cover concepts prior to
lab. This is often quite difficult, particularly
in courses where class and lab are not taught by the
same instructor, and where there is little flexibility
in the lab schedule. Therefore the purpose of
this lab is not to teach students about the details of
plant transport models, rather it is to immerse them
in a semi-guided exploration which yields observations
that are intended to help students understand the
broader connections between physical forces and water
transport in plants. This lab is meant to
precede a more detailed exploration of plant metabolic
processes, and to provide a context for deeper
exploration in class. This lab is also designed around
the idea that students are likely to be more invested
in a science experiment if they are allowed to make
critical decisions about its' design and
execution. This elicits student ownership of the
experiment, and generates intrinsic interest in the
outcome.
Required Materials
- Vernier data loggers and pressure sensors
- Student team computers with MS Excel